GUI Tools
Interactive applications for SOEN model design and analysis
GUI Tools
SOEN Toolkit provides several interactive GUI applications for model creation, parameter visualization, and result analysis. These tools make it easy to work with complex superconducting neural networks without deep knowledge of the underlying configuration formats.
Available GUI Applications
All GUI tools are launched using Python's module system:
Model Creation GUI
Interactive interface for designing SOEN model architectures.
Launch Command
python -m soen_sim_v2.model_creation_guiFeatures
- Drag-and-drop layer creation - Add SingleDendrite, DoubleDendrite, RNN, LSTM, and other layers
- Visual connection editor - Draw connections between layers with automatic constraint checking
- Parameter configuration - Set layer dimensions, solver types, and physics parameters
- Architecture validation - Real-time validation of model topology and parameter compatibility
- YAML export - Generate complete configuration files for training
- Template library - Start from common architectures (feed-forward, recurrent, hybrid)
Layer Types Available
Physical SOEN Layers:
- SingleDendriteLayer
- DoubleDendrite1Layer
- DoubleDendrite2Layer
- ScalingLayer
Virtual Layers:
- InputLayer
- RNNLayer, LSTMLayer, GRULayer
- MinGRULayer
- LeakyRNNLayer
- ClassifierLayer
Connection Types
- Dense connections - Fully connected weight matrices
- Sparse connections - Configurable sparsity patterns
- Custom connectivity - Upload custom connection masks
- Internal connections - Recurrent dynamics within layers
Use Cases
- Rapid prototyping - Quickly test new architectures
- Educational tool - Understand SOEN model structure visually
- Collaboration - Share visual model designs with colleagues
- Architecture search - Systematically explore model variations
Physical Parameter Mapping GUI
Interactive tool for visualizing and configuring superconducting device parameters.
Launch Command
python -m soen_sim_v2.physical_mappings_gui --port 5001Features
Parameter Visualization:
- 3D phase space plots - Visualize φ, g, s parameter relationships
- Time evolution curves - See how parameters change during simulation
- Power consumption maps - Understand energy usage patterns
- Noise visualization - View effect of stochastic perturbations
Interactive Configuration:
- Parameter sliders - Adjust γ₊, γ₋, dt, and other values in real-time
- Source function selector - Choose and configure physics-based activations
- Noise configurator - Set up stochastic and deterministic perturbations
- Constraint editor - Define parameter bounds and relationships
Physical Units:
- Unit conversion - Switch between physical and dimensionless quantities
- Physical constants - Configure Φ₀, Ic, ωc for your specific devices
- Device modeling - Map abstract parameters to real superconducting circuits
Applications
- Device design - Optimize parameters for specific superconducting devices
- Physics education - Understand superconducting dynamics visually
- Parameter tuning - Find optimal settings for your applications
- Validation - Verify that parameters are physically realistic
TensorBoard Results Viewer
Enhanced interface for analyzing SOEN training results and model behavior.
Launch Command
python -m soen_sim_v2.view_tb_results_guiFeatures
Training Analysis:
- Loss curves - Training and validation loss over epochs
- Metric tracking - Accuracy, perplexity, bits per character
- Learning rate schedules - Visualize LR changes during training
- Gradient analysis - Histogram of gradient magnitudes
SOEN-Specific Visualizations:
- Layer state evolution - How layer states change over time
- Power consumption - Energy usage per layer and total
- Physical parameter drift - Track learnable physics parameters
- Connection weight heatmaps - Visualize learned connectivity patterns
Model Behavior:
- State space trajectories - Phase plots of layer dynamics
- Activation patterns - Which neurons are active when
- Time series analysis - Temporal behavior of recurrent layers
- Comparison tools - Compare multiple training runs
Advanced Features:
- Interactive plots - Zoom, pan, select time ranges
- Export capabilities - Save plots and data for publications
- Custom metrics - Add your own analysis functions
- Real-time monitoring - Watch training progress live
Screenshots
Model Creation Interface
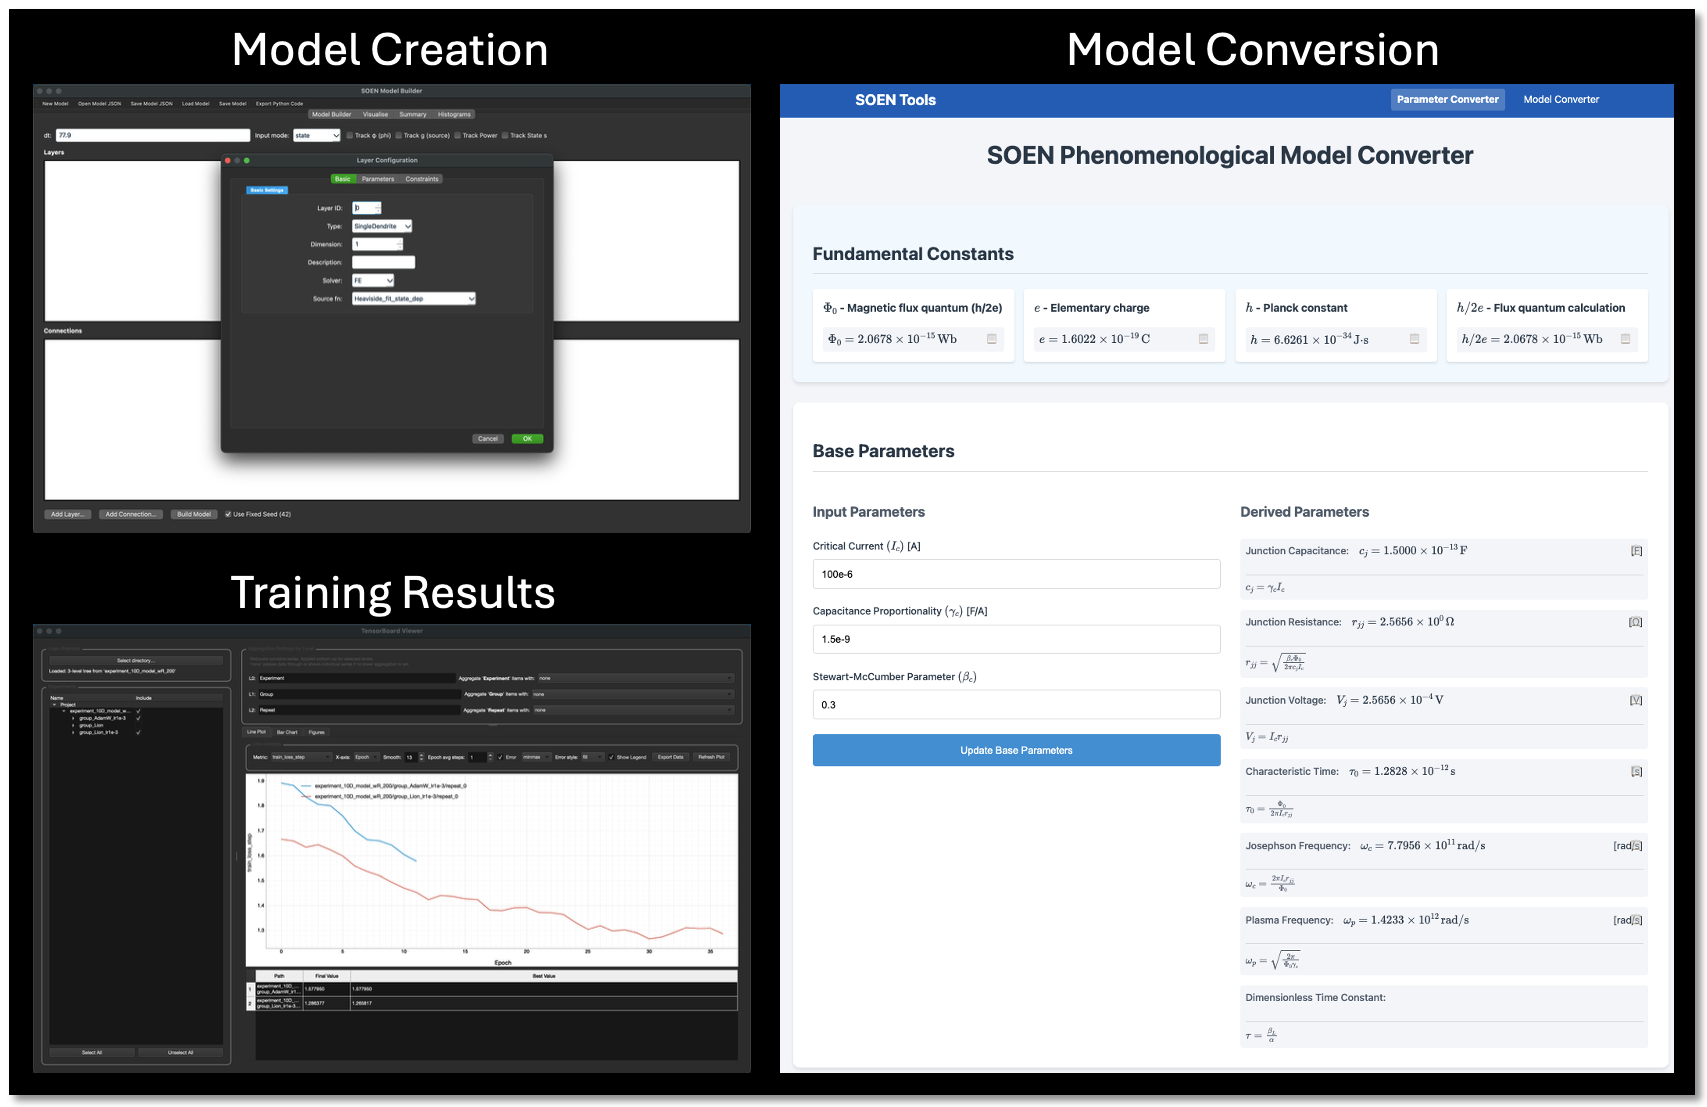
Complete GUI suite: Model Creation, Physical Parameter Mapping, and TensorBoard Results Viewer
🎯 All GUI Tools Integrated
The SOEN Toolkit GUI suite provides comprehensive tools for model design, parameter visualization, and results analysis - all accessible through simple Python module commands.
Installation & Setup
Prerequisites
Follow the instructions found at the GitHub repository: https://github.com/greatsky-ai/soen-toolkit.